

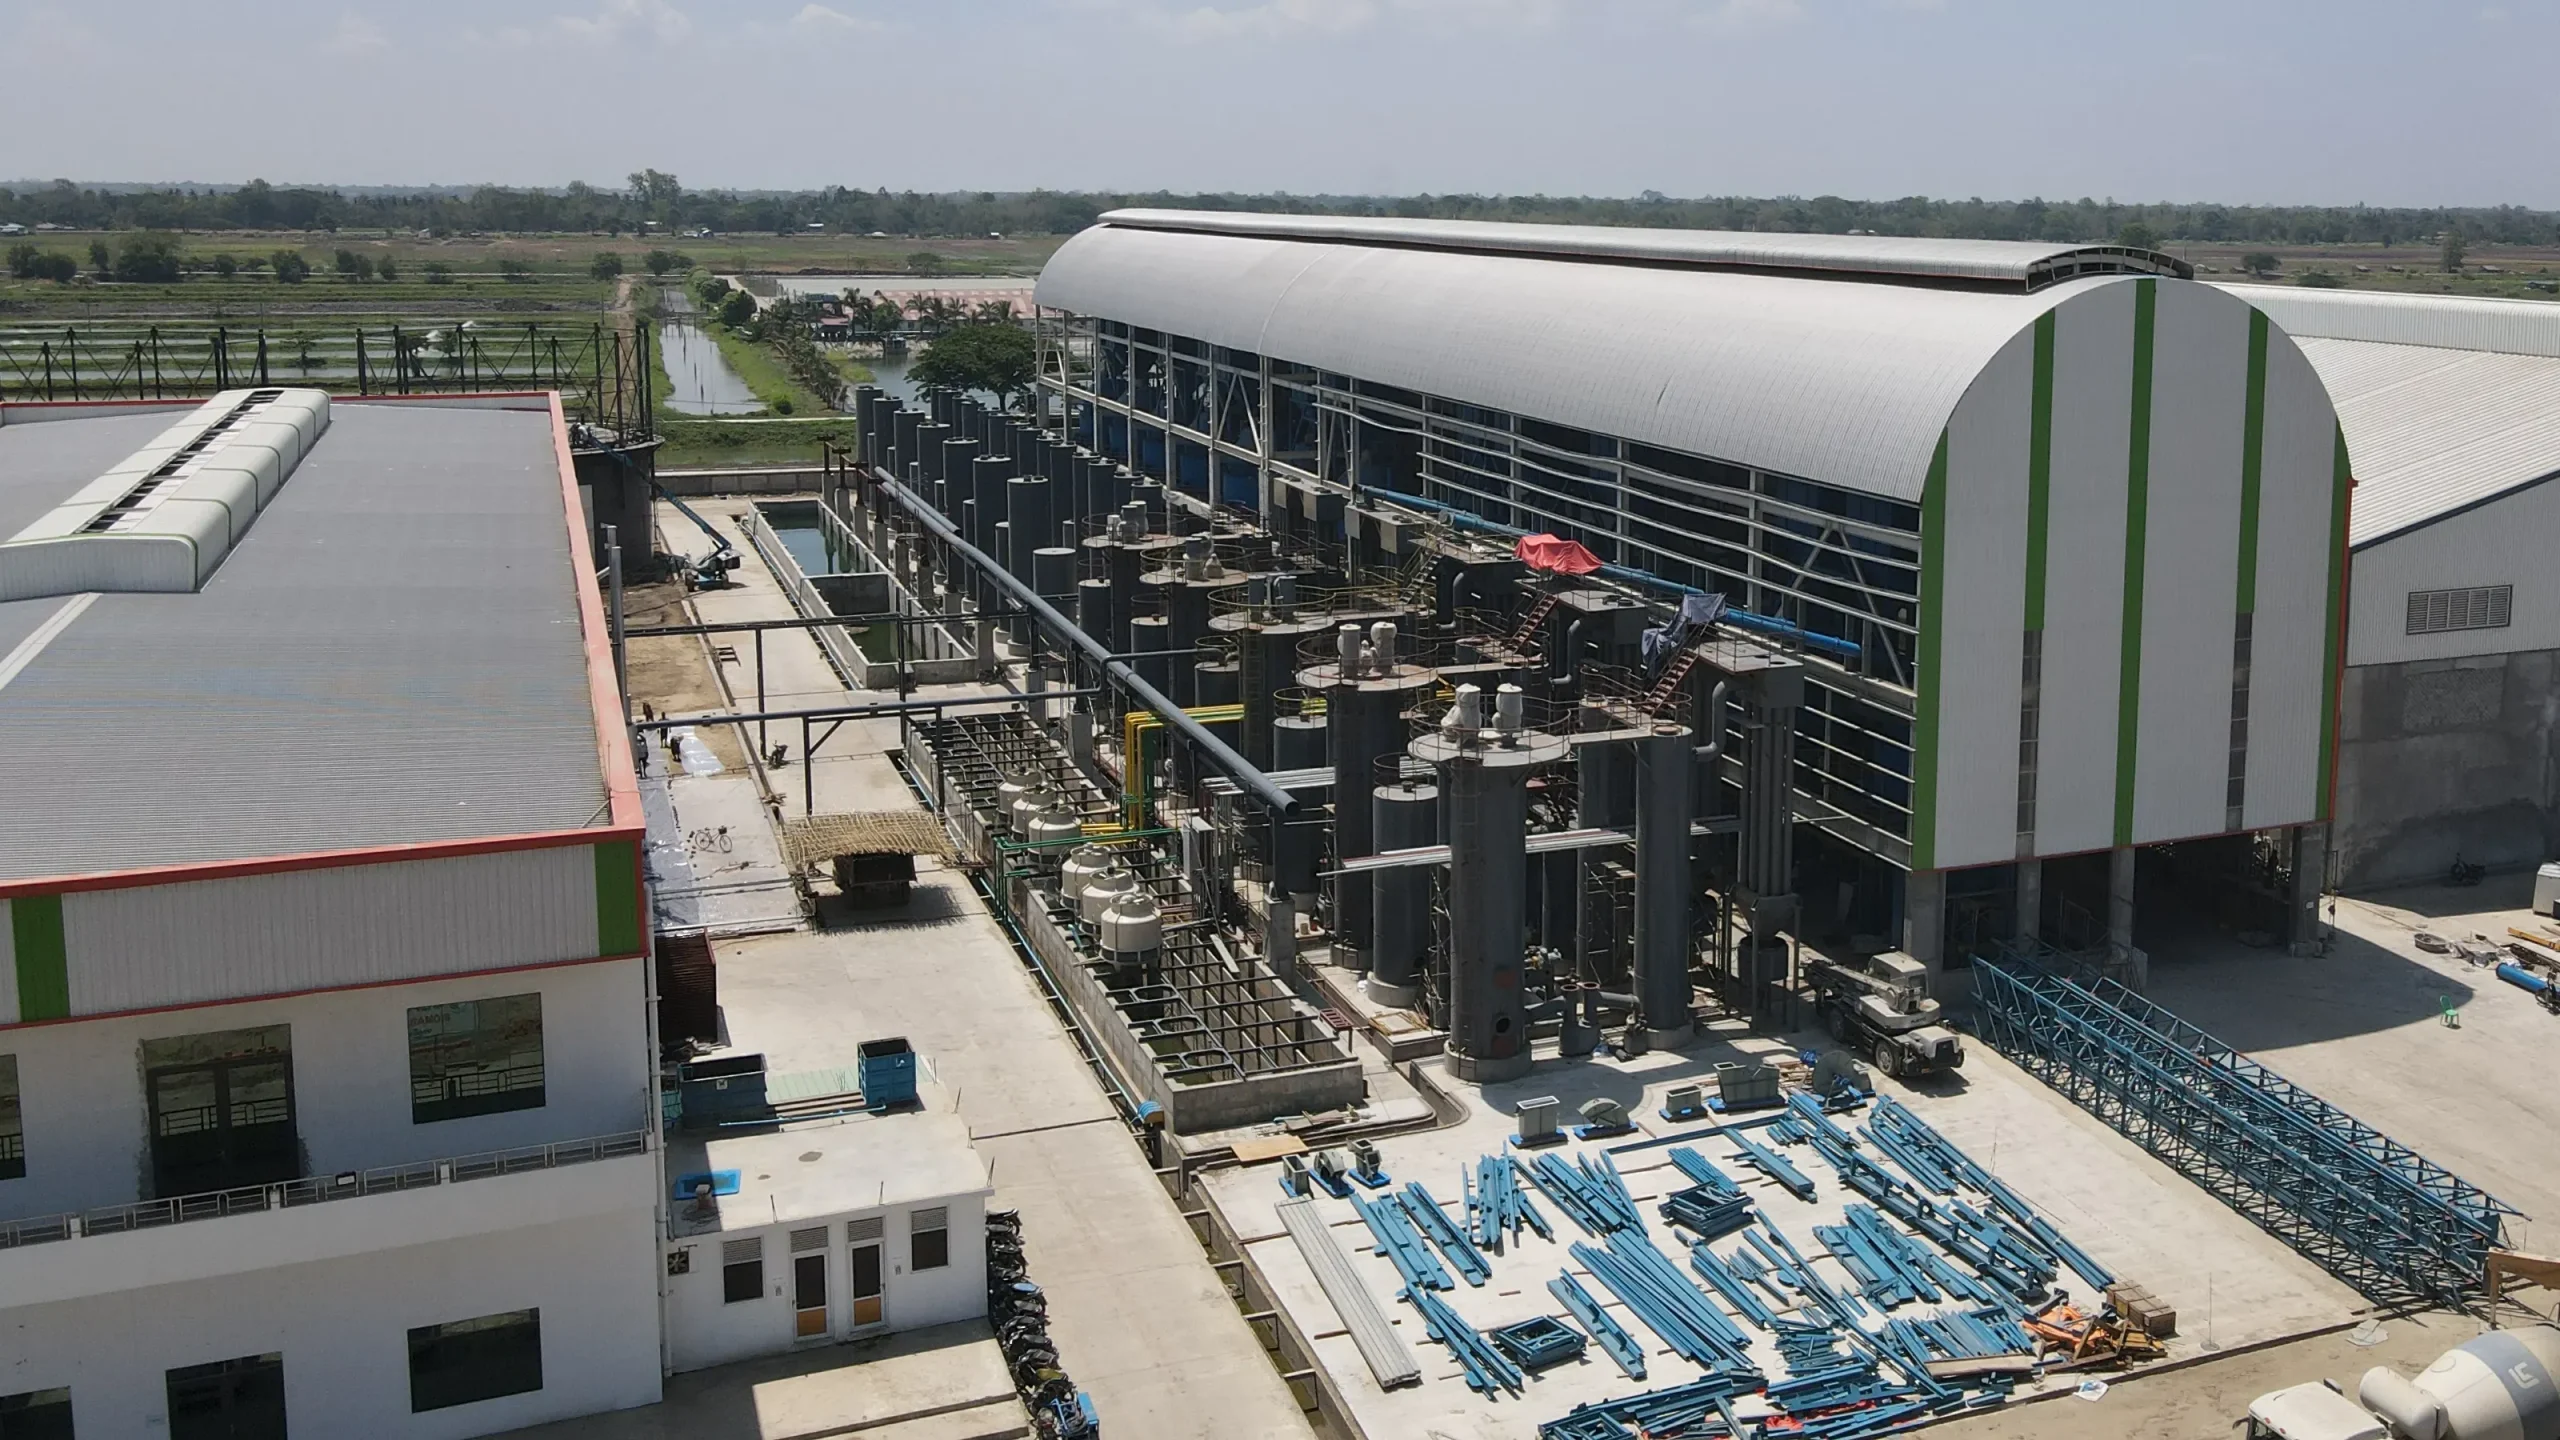
Core Thesis: Biomass energy is a fuel-processing game: 30% technology, 70% operations. While hardware sets the limits of your performance, your supply chain management dictates the reality of your IRR. Models without fuel security are mere theory; projects without operational rigor are high-risk bets.
Part I: Biomass LCOE Benchmarks—What Drives Power Generation Costs in 2026?
1.1 What are the current global LCOE benchmarks for biomass?
Per IRENA’s Renewable Power Generation Costs in 2024 (published July 2025):
| Metric | Value |
|---|---|
| Global Weighted-Average LCOE | $87/MWh |
| LCOE Range | 60–160/MWh |
| 2023-2024 Trend | +13% (the only renewable technology with rising LCOE) |
1.2 How does biomass compare to solar and gas in firm power economics?
| Technology | Firm LCOE ($/MWh) | Key Context |
|---|---|---|
| Solar + BESS | 54–82 | Lower bound in high-irradiance regions (e.g. China, Middle East) |
| New Gas CCGT | $100 | US new-build CCGT reaches $102/MWh (IRENA 2026) |
| Biomass Gasification | 60–90 | Baseload capability; no incremental storage CAPEX |
| Biomass Combustion | $87 | Global weighted-average reference |
1.2 How does biomass compare to solar and gas in firm power economics?
| PPA/FiT Price | Viability | Precondition |
|---|---|---|
| $90/MWh | Standalone viable | Stable fuel supply + capacity factor >70% |
| 70–90/MWh | Conditionally viable | Requires ≥1 additional revenue stream (CHP / co-products / carbon credits) |
| <$70/MWh | Severely challenged | Pure power generation is not bankable |
1.4 LCOE Sensitivity Rankings
Fuel Cost (highest): +10% fuel → +5-7% LCOE
Capacity Factor: -5% capacity factor → +8-10% LCOE; also drives -2 to -4 percentage points in project IRR
WACC: +100bps → +3-5% LCOE
CAPEX: +10% → +2-3% LCOE
The “30/70” thesis is directly reflected in these sensitivities—operational factors, not hardware, dominate financial outcomes.
Part II: Biomass Plant CAPEX—Evaluating Construction Costs and Risks
2.1 Global Baseline
Weighted-Average: $3,242/kW
Range: 2,000–5,500/kW
Warning: Total installed costs rose +16% in 2023-2024, driven by supply chain pressure and skilled labor inflation in Western markets
2.2 Technology Route Comparison
| Route | CAPEX | Construction | Capacity Factor | Core Advantage | Core Risk |
|---|---|---|---|---|---|
| Direct Combustion | $3,000–5,000/kW | 18–24 months | 70–80% | Most mature | Labor overrun risk (30%+ in Western markets) |
| Co-firing Retrofit | $150–300/kW (incremental) | 6–12 months | Same as host unit | Lowest investment; 300+ global retrofits | Higher blend ratios require pretreatment |
| Modular Gasification | $3,500–5,500/kW | 9–15 months | 75–85% | Fast deployment; avoids on-site labor risk | 20–40% hardware premium |
| BECCS | +$2,000–4,000/kW | +12–18 months | — | Negative emissions pathway | Early commercial stage; no established CDR revenue floor yet |
2.3 Is modular gasification worth the hardware premium?
Modular gasification is a strategic shift: trading higher equipment CAPEX for compressed timelines and mitigated on-site risk.
The Cost: A 20–40% hardware premium over traditional boiler systems.
The Gains: Shortened construction and the elimination of 30%+ labor-related cost overruns common in traditional site-built projects.
The Breakeven: The trade-off only succeeds if superior feedstock flexibility lowers your OPEX enough to recoup the CAPEX premium within 3–5 years.
Investment Verdict: If your modular gasifier is limited to the same premium-grade feedstock as a conventional boiler, the value proposition vanishes. The modular premium is only justified when it unlocks access to lower-cost, high-moisture, or waste-grade fuel sources.
Part III: Biomass Fuel Supply Chains—Why Operational Rigor Defines Success
3.1 The Dominance of Fuel Costs
Fuel procurement and logistics account for 50–70% of total OPEX (cross-validated across multiple independent sources).
3.2 Global Pellet Price Benchmarks (2026)
Industrial wood pellets: 165–210/ton (FOB primary markets)
Asian delivered cost (Japan/Korea): frequently exceeds $220/ton
Global pellet production forecast 2026: >48 million tons; North America + Europe = ~72% of global output
3.3 How does feedstock quality impact your levelized fuel cost?
| Feedstock | Moisture | LHV (GJ/ton) | Delivered Cost | Fuel Cost/MWh |
|---|---|---|---|---|
| Premium Wood Pellets | <15% | 17–19 | $120–210/ton | $40–60 |
| Wet Wood Chips | 40–55% | 8–10 | $30–60/ton | $25–40 |
| Agricultural Residues | 10–30% | 12–15 | $20–50/ton | $15–30 |
Investment Insight: Feedstock flexibility is the difference between a project and a liability. Systems tethered to premium fuel sacrifice 25–45/MWh in margin compared to flexible gasifiers. Over 20 years, it’s a massive wealth transfer from your shareholders to your fuel suppliers.
3.4 Collection Radius
| Feedstock Type | Economic Radius |
|---|---|
| Low-density (straw, rice husk) | 30–50 km |
| Medium/high-density (forestry residues, wood chips) | 80–100 km |
Logistics costs exceeding 50% of total feedstock cost is a common failure mode.
3.5 Capacity Factor—The IRR Multiplier
IRENA global weighted-average: 73% (~6,400 hours/year)
Emerging-market reality: often <6,000 hours/year
Financial sensitivity: Every 5-percentage-point drop in capacity factor reduces project IRR by 2–4 percentage points
Due Diligence Requirement: Assumptions must be anchored to regional benchmarks for comparable projects, not equipment nameplate ratings
3.6 Ash Disposal—The Hidden Cost
Biomass ash is chemically aggressive—high potassium and chlorine levels can turn a reliable boiler into a maintenance nightmare. Unplanned outages are rarely “accidental”; they are the result of poor ash modeling. Don’t hide these costs in a “miscellaneous” bucket. Isolate ash disposal as a dedicated O&M line item to reflect the operational reality of the plant, not just the equipment’s design specifications.
Part IV: Beyond PPAs—How to Maximize Revenue with CHP and Carbon Assets
4.1 The Revenue Stack
| Layer | Source | Certainty | Contribution Potential | Key Precondition |
|---|---|---|---|---|
| Foundation | PPA / FiT | High | 60–80% | Long-term contract locking price and tenure |
| Amplifier | CHP Heat Sales | Med-High | Can exceed power revenue (industrial park scenarios) | Stable offtaker within proximity |
| Value-Add | Biochar / Syngas | Medium | $20–50/ton (biochar) | Established downstream buyers |
| Upside Option | Carbon Credits (CDR / REC) | Low-Med | $50–200+/ton CO₂; a 10 MW plant can deliver ~10,000+ tons/year removal | Methodological approval and market access |
4.2 CHP: The Critical Value Multiplier
CHP (Combined Heat and Power) is the ultimate efficiency hack for biomass projects, boosting energy utilization from ~30% (power-only) to over 70% in integrated mode. In industrial park settings, thermal revenue often eclipses electricity sales, providing a much more stable and resilient cash-flow profile. Europe is already pivoting: France’s Heat Fund deploys ~€800 million annually, evolving biomass-for-heat from a niche benefit into a primary infrastructure mandate.
4.3 Carbon Assets: From “Nice-to-Have” to Revenue Pillar
Scientifically rigorous CDR platforms like Isometric are transforming carbon monetization from speculative to structural. Isometric pre-approval serves as a top-tier validation of your MRV methodology, slashing the risk-discount on carbon credits and enabling premium pricing.
Our investment verdict: Treat carbon assets as a “Call Option” on your project. Exclude them from your base-case financial model, but ensure your technology selection structurally enables them from Day One. This captures massive upside as carbon markets mature, without tying your project’s survival to them.
Part V: Technology Selection—Should You Choose Direct Combustion or Gasification?
| Metric | Direct Combustion | Modular Gasification |
|---|---|---|
| Maturity | High | Commercial-emerging |
| Electrical Efficiency | 20–28% | 25–35% |
| CHP Efficiency | 80–90% | 74–85% |
| Carbon Conversion Rate | — | Up to 94.5% |
| Fuel Tolerance | Low-Moderate | High (moisture up to 50–60%) |
| CAPEX | $3,000–5,000/kW | $3,500–5,500/kW |
| Construction | 18–24 months | 9–15 months |
| Emissions Control | Post-combustion flue gas | Pre-combustion syngas cleaning |
| Co-products | Ash | Biochar + Syngas |
| Carbon Market Access | Low | High (pre-approved pathways) |
| Ash Handling Risk | High (fly ash, corrosion) | Moderate (dry ash, pre-cleaned syngas) |
Decision Tree:
What feedstock is actually available?
Premium (dry chips / pellets) → Direct Combustion (lowest CAPEX)
Low-quality / mixed → Go to Q2
What is the labor cost environment?
High (Western markets) → Modular Gasification
Low (SE Asia / Africa) → Site-built Gasification or Combustion
Is carbon asset monetization required?
Yes → Must select a route with Isometric or equivalent pre-approval
No → Follow feedstock and labor cost logic above
Part VI: Policy Impacts—How to Stress-Test Your Project Against Subsidy Phase-outs
| Region | Key Trend | Investment Implication |
|---|---|---|
| EU | RED III tightening; EUDR deforestation obligations; shift from power to heat support | Compliance costs rising; export-oriented projects require supply chain audit |
| UK | Drax subsidy £999M (2025) → ~£460M/year (from 2027) | Subsidy phase-down is a certainty; model the cliff |
| China | Legacy FiT phase-down; 10%+ co-firing mandate for coal plants | Pure power generation narrowing; CHP and industrial self-supply are the path forward |
| SE Asia | Vietnam ~800 MWel expected; Cambodia industrial park self-supply model emerging | Park-based CHP + PPA offers highest revenue certainty |
| North America | CDR market infrastructure advancing; Isometric establishing MRV standard | Premium carbon credit pathway forming |
Policy Stress Test:
Base-case model must not rely on subsidies for >50% of revenue
Full phase-down scenario testing is mandatory
Part VII: Global Market Landscape and Benchmark Projects
7.1 Market Size
2026: ~$68.48 billion
2030: $89.18 billion (CAGR 6.8%)
2025: 5,800+ plants, 94.7 GWel; ~3 GWel added
2034 forecast: ~6,800 plants, ~109 GWel
7.2 Lessons from Benchmark Projects
| Project | Model | Key Takeaway |
|---|---|---|
| Poland Grudziądz | 12.5 MW straw retrofit into existing turbine + district heating | Retrofitting existing thermal assets + local low-cost feedstock = lowest-risk path |
| Cambodia Kratie | $24M CHP park supplying tire factory; PPA + heat contract dual-locked | SE Asia park-based self-supply is the highest-certainty model for emerging markets |
| UK Drax | £947M EBITDA but £999M in subsidies | Subsidy-dependent assets face valuation cliff risk when policy support unwinds |
| Baltic BECCS | Waste wood + CO₂ capture; EU Innovation Fund applicant | BECCS entering pre-development phase; policy catalysts still required |
Part VIII: Investment Risk Checklist
“Fatal” Risks (Single-point failure → not investable)
| Risk | Gate | |
|---|---|---|
| 1 | Unsecured fuel supply | <70% of life-of-project requirement under long-term contract |
| 2 | Subsidy dependence >50% of revenue | And full phase-down scenario not stress-tested |
| 3 | Technology-fuel mismatch | Selected equipment cannot handle actually available feedstock |
| 4 | PPA/FiT below LCOE + margin | Insufficient headroom throughout payback period |
“Major” Risks (Material IRR impact)
| Risk | |
|---|---|
| 5 | Capacity factor assumption >10% above regional benchmark |
| 6 | Ash disposal cost not separately modeled |
| 7 | Missing sustainability certification (EU RED III / EUDR) |
| 8 | Underestimated feedstock competition within collection radius |
| 9 | Grid interconnection complexity and cost underestimated |
“Upside Option” Risks (Limited downside, significant upside)
| Risk / Opportunity | |
|---|---|
| 10 | BECCS/CDR market not modeled in base case (structure as a call option) |
| 11 | CHP offtaker ramp-up slower than projected (mitigate via minimum offtake clauses) |
| 12 | Carbon credit price realization (model conservatively at $20–50/ton for base case) |
Part IX: The Five-Question Investment Gate
No project should proceed to full due diligence until it passes all five:
| Question | Gate | |
|---|---|---|
| 1 | Fuel: Is ≥70% of life-of-project feedstock requirement secured via long-term contract with price adjustment mechanisms? | Yes/No |
| 2 | Technology: Does the selected technology precisely match the actual characteristics (moisture, ash, calorific value) of the available feedstock? | Yes/No |
| 3 | Revenue: Does the project have at least two independent revenue streams? | Yes/No |
| 4 | Policy: Is the offtake/revenue framework stable throughout the investment payback period? Has a full phase-down scenario been tested? | Yes/No |
| 5 | Exit: Is a viable exit path identified (strategic buyer / infrastructure fund / IPO)? | Yes/No |
A project that fails any single gate is not yet investable.