

Calculate HFO power plant cost per kWh by dividing annualized whole-plant cost by the net electricity the site can actually use or sell. The numerator must include fuel, treatment, auxiliaries, maintenance, overhaul reserves, environmental obligations, and capital recovery. The denominator must exclude electricity consumed inside the plant.
Engine price rarely decides the result. A low equipment quote can still produce expensive electricity when the model assumes full-load fuel consumption, ignores hot-climate derating, or divides cost by gross generator output. Build the energy denominator first; then make every cost match that boundary.
Which cost per kWh are you calculating?
A feasibility model, a levelized cost model, and a required sales tariff answer different questions. Mixing them creates false precision.
Use a screening cost for early equipment and fuel comparisons:
Screening cost per net kWh = annualized CAPEX + annual fuel cost + fixed O&M + variable O&M + overhaul reserve + annual compliance costs, divided by annual net electricity.
A bankable model discounts every future cost and net kilowatt-hour to the same date, then adds project-specific financing, taxes, working capital, escalation, decommissioning, and owner-return requirements. The required tariff can therefore exceed technical generation cost.
Write the model boundary on the first worksheet: plant gate, customer busbar, or grid delivery point. Do not compare bids until they use the same boundary, currency basis, and price date.
How do you calculate annual net electricity?
A 1 MW nameplate does not produce 8.76 million saleable kilowatt-hours every year. Dispatch, outages, part-load operation, site derating, and auxiliaries reduce that denominator.
Start with these equations:
Gross annual generation = gross site-rated capacity × 8,760 hours × gross capacity factor Net delivered generation = gross annual generation − plant auxiliary electricity − delivery losses
Capacity factor should come from the dispatch case, not availability. A plant can be ready but idle or run below nameplate. Model unit commitment by load band when multiple engines follow demand.
Auxiliaries include fuel pumps, separators, heaters, booster modules, cooling fans, water treatment, compressed air, and emissions equipment. Engine-driven pumps may be reflected before generator output is measured; electrically driven equipment appears as station demand. Count each load once.
Ask bidders for site-rated gross output, auxiliary demand, and net output under the required ambient and fuel conditions. Calculate the denominator from those guarantees.
How do you turn HFO use into annual fuel cost?
Calculate engine fuel by load band
Use a load-weighted fuel-consumption curve because one full-load SFOC value cannot price a plant that changes load. For each operating band, multiply gross generation by the guaranteed specific fuel oil consumption.
Engine fuel, t/y = sum of gross kWh at each load × SFOC in kg/kWh ÷ 1,000 Annual fuel cost = purchased HFO tonnes × delivered price per tonne + startup and flushing fuel + fuel-related fees
Check whether the stated SFOC includes the permitted tolerance. A declaration made with ISO tolerance may allow actual consumption to exceed the headline value while the engine still meets its contract. Apply the contractual guarantee, not the best value in a brochure.
Convert engine consumption to purchased fuel
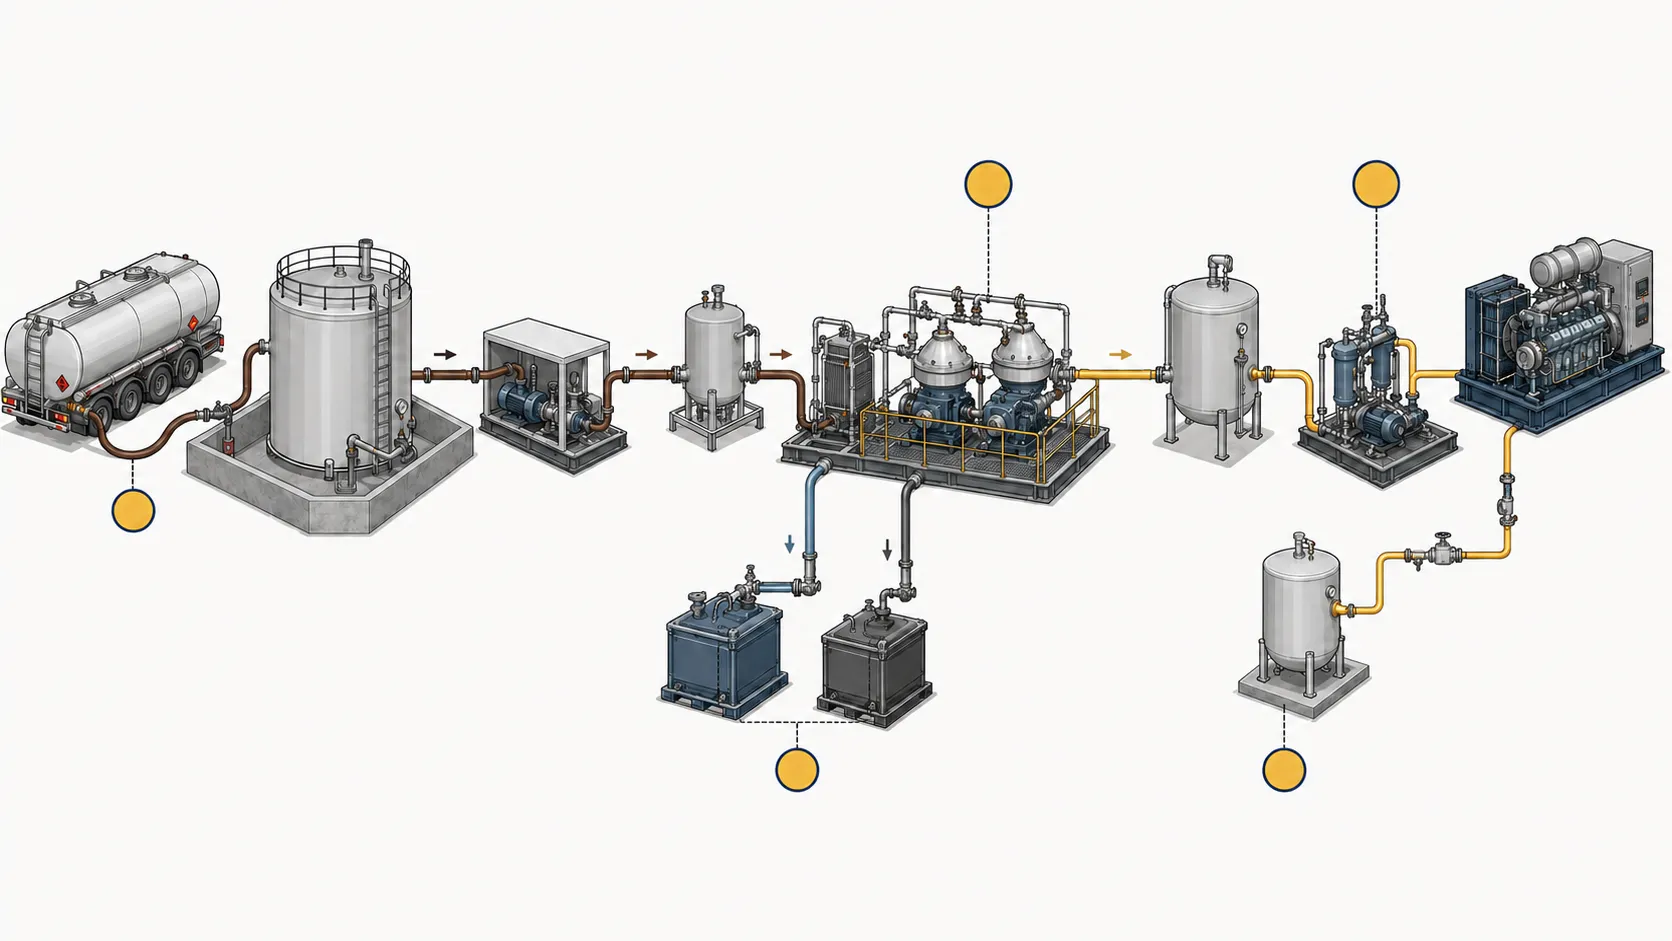
Engine consumption is not identical to purchased fuel. Water and solids removed during treatment, tank residues, sampling, transfers, and sludge disposal affect the mass balance.
An HFO fuel treatment system also consumes heat, electricity, filters, and treatment resources. Diesel used for startup, shutdown, and flushing belongs in the same fuel budget.
Reconcile monthly tank receipts, treated-fuel flow, engine counters, and sludge removal so the financial model can be tested against operation.
How should CAPEX enter the calculation?
Annualize the whole-plant investment
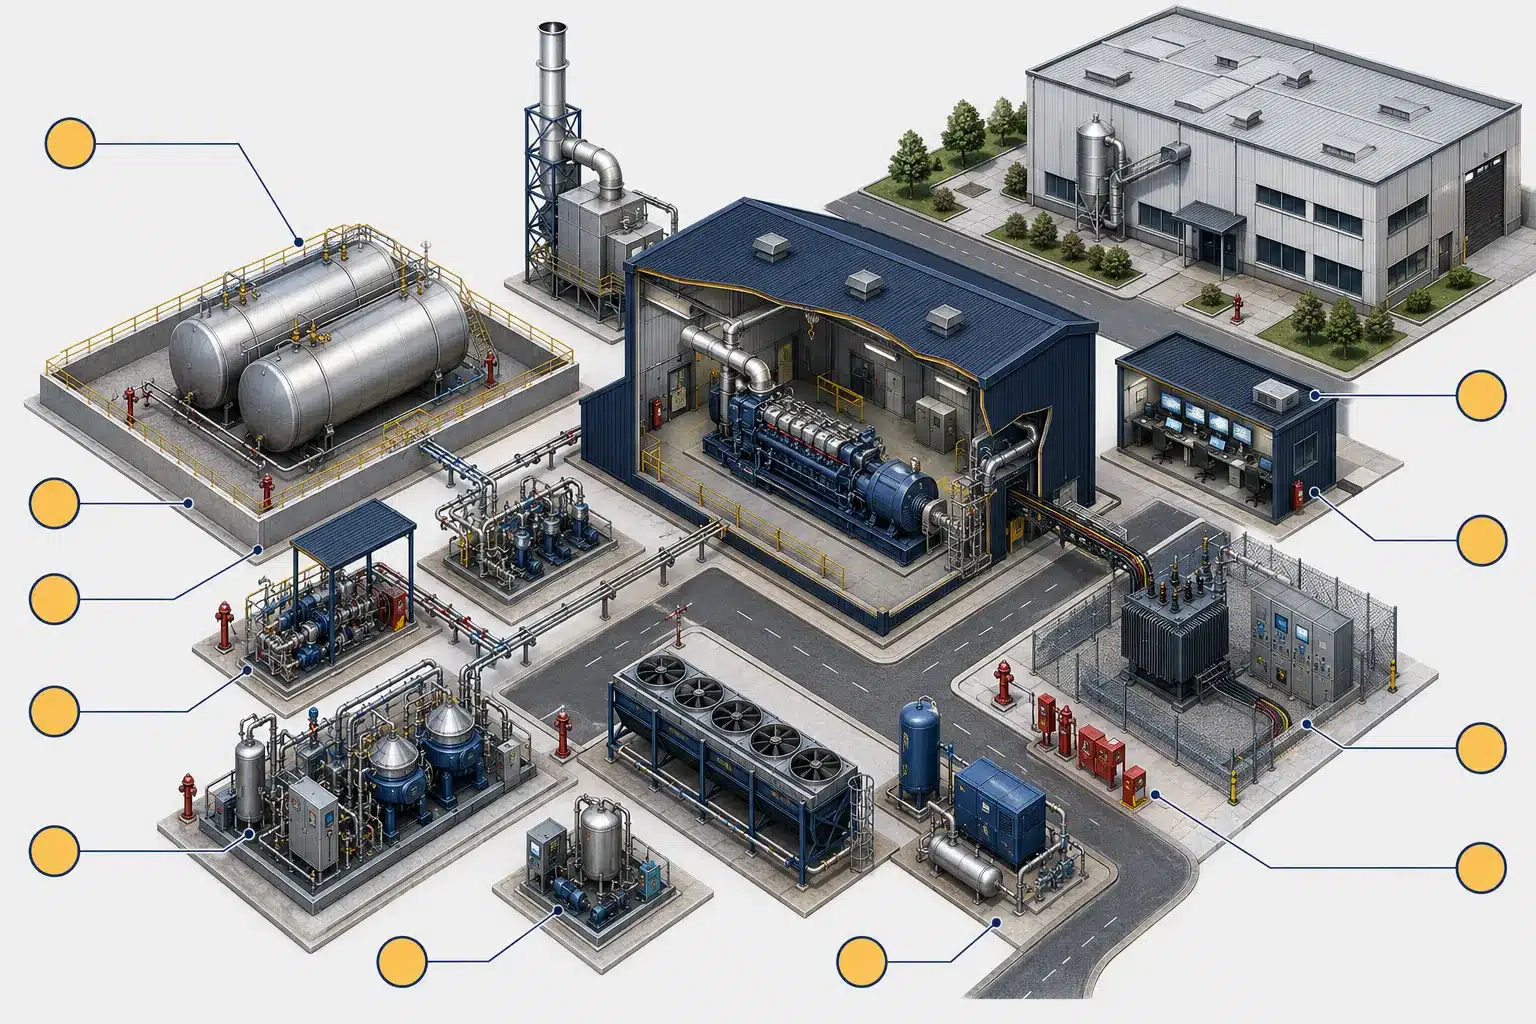
Annualize the complete installed investment, not the engine purchase price. An HFO plant CAPEX boundary can include engines and alternators, bulk storage, transfer, heating, separation, service tanks, cooling, exhaust treatment, electrical systems, buildings, fire protection, engineering, commissioning, initial spares, and grid connection.
For a simple constant annual charge, calculate the capital recovery factor:
CRF = i(1 + i)^n ÷ ((1 + i)^n − 1)
Here, i is the discount rate and n is the recovery period in years. Annualized CAPEX equals total installed CAPEX multiplied by CRF. This method is useful for screening, but it does not replace a project-finance model with staged construction payments, debt sculpting, tax, and replacement schedules.
Match the bid boundaries
Define responsibility before requesting prices. A medium-speed HFO generator plant quote may cover a different boundary from a complete EPC project development proposal. Put exclusions beside the estimate instead of hiding them in a contingency percentage.
Use either real costs with a real discount rate or nominal costs with a nominal rate. Mixing the two can distort the capital charge more than a small equipment-price discount.
What does a worked HFO cost model look like?
Run one transparent screening case
The following hypothetical 1 MW case represents a small industrial plant with a steady process load. It produces USD 0.212 per net kWh. It demonstrates the calculation only; none of its inputs is a market quotation or product guarantee.
For the calculation, gross capacity factor is 80%, auxiliary demand is 6%, installed CAPEX is USD 1.5 million, the recovery period is 15 years, the discount rate is 10%, load-weighted SFOC is 205 g/kWh, and delivered HFO is USD 600/t. Gross generation is 7.008 million kWh/y, while net delivered generation is 6.588 million kWh/y. The CAPEX assumption uses a relatively high cost per kilowatt because fuel storage, treatment, controls, and commissioning do not shrink in direct proportion to engine output.
| Model item | Calculation | Annual cost |
| Annualized CAPEX | USD 1.5 million × 0.13147 CRF | USD 0.197 million |
| HFO | 7.008 million kWh × 0.205 kg/kWh × USD 600/t | USD 0.862 million |
| Fixed O&M and staffing | Assumption | USD 0.150 million |
| Variable O&M, lubricants and treatment | USD 0.013/gross kWh | USD 0.091 million |
| Overhaul reserve | USD 0.008/gross kWh | USD 0.056 million |
| Insurance, monitoring and waste | Assumption | USD 0.040 millio |
| Total annualized cost | Sum of annual costs | USD 1.396 million |
| Screening cost | USD 1.396 million ÷ 6.588 million net kWh | USD 0.212/net kWh |
Read the denominator error
Dividing the same cost by gross generation would show USD 0.199/kWh. Ignoring both auxiliary demand and the overhaul reserve would reduce the apparent result to about USD 0.191/kWh—roughly 10% below the properly bounded value. Test the denominator and reserve policy before debating the third decimal place.
Check whether HFO fits a smaller site
A 1 MW plant in this case delivers an average net output of about 752 kW. It is oversized for a factory that normally uses 200 or 300 kW, even if the site’s short peak approaches 1 MW.
Small projects carry a larger share of fixed fuel-treatment, storage, staffing, and compliance cost per kilowatt. Compare HFO with diesel, gas, grid power, and a hybrid system before selecting the fuel. If the site cannot keep the plant well loaded for most operating hours, lowering the engine price will not make the cost per kWh competitive.
Which assumptions need downside cases?
Six inputs can reverse the conclusion even when the base case looks attractive:
Market and performance risks
- Delivered HFO price: Test supplier failure, port charges, inland transport, inventory financing, and currency movement—not only the commodity quotation.
- Load and dispatch: Use hourly demand or representative load bins. Low utilization spreads fixed cost across fewer kilowatt-hours and can move engines away from their best fuel-consumption range.
- Fuel consumption: Apply site conditions, operating load, and contractual tolerance. Include performance deterioration between overhauls when the supplier provides a defensible curve.
Operating and compliance risks
- Auxiliary demand: Test the hottest credible ambient condition, treatment redundancy, and the selected cooling arrangement.
- Availability and overhaul timing: Link outage hours, spare-unit policy, parts lead time, and overhaul cash flow instead of using one optimistic annual percentage.
- Fuel quality and compliance: Price additional treatment, rejected deliveries, lower-sulfur fuel, monitoring, sludge, and oily-water handling when the fuel specification or permit requires them.
Do not change each variable independently by an arbitrary 10%. Build a base year, a bad operating year, and a supply-disruption case in which related assumptions deteriorate together.
What must bidders guarantee?
A comparable HFO bid needs guaranteed site performance and a responsibility matrix. Give every supplier the same load profile, ambient data, fuel analysis, emissions basis, and maintenance philosophy.
Request these outputs in a common format:
- Gross and net output at each required operating condition
- SFOC at several load points, with fuel basis and tolerance stated
- Auxiliary demand by system and operating mode
- Planned maintenance hours, overhaul intervals, and major-parts scope
- Fuel-treatment capacity, standby philosophy, and diesel changeover demand
- Consumables, lubricating oil, waste streams, and recommended onsite spares
- Emissions-control loads, monitoring needs, and performance conditions
- CAPEX inclusions, exclusions, price basis, and commissioning boundary
Powermax Energy should connect equipment scope with O&M maintenance when evaluating an integrated HFO project. Make suppliers prove the annual net kilowatt-hours and recurring costs their offer creates.
A credible HFO cost model should survive a bad year
Use USD/kW to screen investment size, but use cost per net kWh to judge competitiveness. One fuel-delivery problem, one major overhaul, and a realistic dispatch year should not destroy the economic case.
Freeze the calculation boundary before negotiating engine price. Replace assumptions with guarantees, keep a downside case, and reconcile the model after commissioning. The useful model is not the one with the lowest answer; it identifies the assumption that the fuel contract, EPC scope, or maintenance plan must protect.